
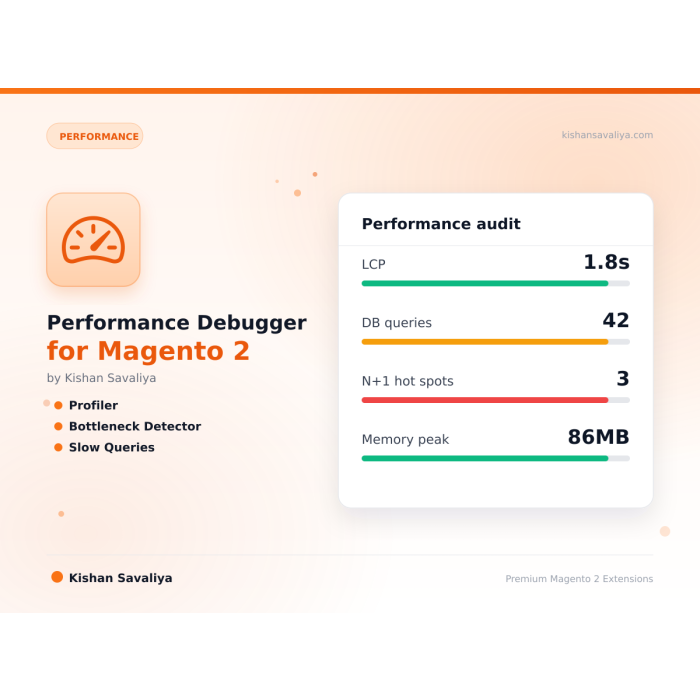
Performance Debugger for Magento 2
Magento 2 performance debugger - floating storefront toolbar with bottleneck detection, severity scoring, suggested fixes and XLSX/PDF report export. Tracks render time, observers, plugins, layout, DI, slow + duplicate + N+1 DB queries and memory.
Magento 2.4.6, 2.4.8
PHP 8.1, 8.4
Hyva + Luma Ready
Free
Additional Services
$0.00
In stock
SKU
panth-performance-debugger
Lifetime Updates
Every Magento release
1-Year Free Support
Email + WhatsApp
Adobe-Certified
Magento 2 Developer
Free Forever
No subscription, no upsell
Overview
The Performance Debugger for Magento 2 is a production-grade frontend profiler for Magento 2 and Adobe Commerce that surfaces per-page render time, slow database queries, plugins, observers, and memory usage in a floating storefront toolbar. It turns "the site feels slow" into a prioritized fix list with severity scores and estimated millisecond savings.
The floating toolbar runs on every storefront page (gated by admin IP allowlist so it never leaks to real customers) and shows a per-collector breakdown: block render, observers, plugins, layout XML, DI resolution, queries, memory. The N+1 detector and duplicate query roll-up catch the worst offenders fast - a single product page firing 200 redundant SELECTs lights up in the toolbar instantly. Each issue ships with a severity score and a suggested fix so engineers can prioritize by milliseconds saved instead of gut feel.
The Performance Debugger for Magento 2 also exports XLSX and PDF reports for stakeholder reviews or ticket attachments, works on both Hyva and Luma without theme changes, and installs cleanly via Composer with zero core hacks. Tested on Magento 2.4.4 - 2.4.8 with PHP 8.1 - 8.4. Free forever, MIT-style open source, source included so you can read, modify, or extend any collector.
Best for:
- Stores fighting for green Core Web Vitals and sub-2.5 s LCP on real PDPs
- Engineering teams hunting N+1 query patterns introduced by third-party extensions
- Agencies producing performance audit reports for clients without scraping logs
What you get
The Performance Debugger for Magento 2 surfaces every metric that matters in production:
- Floating storefront toolbar with per-collector breakdown and IP-allowlist gating
- N+1 and duplicate query detection with roll-up grouping by SQL signature
- Severity scoring plus suggested fixes and estimated millisecond savings per issue
- Block render, observer, plugin, layout XML, DI, query, and memory collectors
- XLSX and PDF report exports for stakeholder reviews or ticket attachments
- Hyva plus Luma compatible, Composer-installable, source-included, free forever
Performance Debugger for Magento 2. A premium Magento 2 extension built by Top Rated Plus developer Kishan Savaliya.
⚡What it doesDrop-in Magento 2 extension that ships polished, production-tested functionality with zero subscription cost.
🎯Best forStores fighting for green Core Web Vitals and sub-2.5 s LCP
✓CompatibilityMagento 2.4.4-2.4.8 · PHP 8.1-8.4 · Hyva + Luma
🔓LicenseFree forever · No subscription · MIT-style open source
Production-grade Magento 2 frontend performance profiler. Floating storefront toolbar surfaces render time, DB queries (slow + duplicate + N+1), plugins, observers, layout XML, DI resolution and memory, with severity scoring, fix suggestions, estimated savings and exportable XLSX/PDF reports.
Highlights
- Floating storefront toolbar - per-page render breakdown without leaving the frontend
- Per-collector toggles - block render, observers, plugins, layout XML, DI, queries, memory
- N+1 detection + duplicate query roll-up - finds the worst offenders fast
- Severity scoring + suggested fixes - tells you what to do, not just what is slow
- Estimated savings per fix - prioritise by ms saved, not gut feel
- XLSX and PDF report export - share with stakeholders or attach to tickets
- Hyva + Luma compatible - works on any frontend
- Production-safe - admin IP allowlist prevents toolbar leakage
What you get
- Composer-installable Magento 2 module (no core hacks)
- Tested on Magento 2.4.4 to 2.4.8, PHP 8.1 to 8.4
- One-year support and free updates
- Source code included - read, modify, extend
| Module Category | Performance |
|---|---|
| Best For | All Sizes |
Need this customised?
Talk to Kishan directly: written quote, scope and timeline within 24 hours. No sales call.
Performance Debugger for Magento 2
$0.00
You might also like
Related products


Step up